


After a season as a minor-league baseball play-byplay announcer for the Columbia Mules, biologist Michael Eisen moved on to his fallback career: science. Eisen posted impressive stats after being drafted by Berkeley, publishing widely, and co-founding the Public Library of Science—an online library of openaccess science and medical publications. But despite his success, some part of Eisen still wishes he were back in the ballpark.
On a Thursday evening, 11 students make their way to his basement classroom in Powle residence hall and slouch into chairs around a central table. The students are all male. Most, including graduatestudent instructor James Fraser, wear jeans and sweatshirts, the kinds of guys who always ask for “the usual” when they sit down in a barbershop chair. Eisen himself wears his curly black hair in a style that’s more “mad scientist” than “star pitcher.”
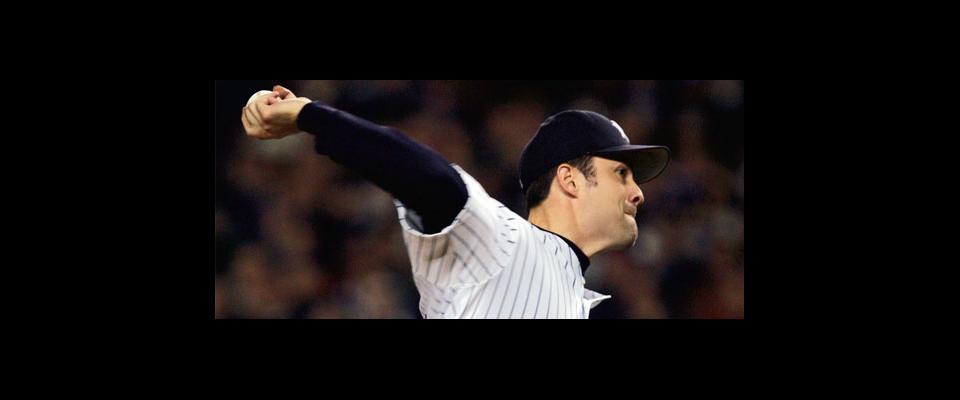
Ostensibly, the students come to study the statistical methods used in genome sequence analysis. But Eisen has no intention of covering biology. Instead they spend the hour talking about stolen bases, sacrifice bunts, and the seventh inning of the first game of the 2004 American League Championship Series (when the Boston Red Sox broke New York Yankees pitcher Mike Mussina’s perfect game with five runs).
The class is based on the fact that baseball wonks and genome analysts use identical methods in their work. “It’s no coincidence that we are both doing this type of science,” Eisen says, motioning to his assistant, Fraser, a devoted Toronto Blue Jays fan. The study of both baseball and biology requires a mind that can combine statistics with the unruly facts of any individual case. The math is the same whether you are trying to determine if a chunk of DNA is a functioning gene or deciding whether the benefit of getting a runner to second outweighs the cost of having him picked off.
“You’ll never be able to figure it all out with some perfect formula,” Eisen says. “You have to love its messiness; if you treat it too purely, you are going to fail because—”
“Because the data sets are wonderfully imperfect,” Fraser says.
“Exactly,” Eisen continues. “If you took the best mathematician from Europe and put him to work doing statistical analysis for the Oakland A’s, he’d be lousy. You have to understand the game.”
As a result, most of the statistical analysis is pretty basic math—the hard part is figuring out the right question to ask. In the course of the evening, the class calculates its way to several discoveries: sacrifice bunts are almost always a bad idea, stealing second makes sense only if you have a runner who makes it at least 75 percent of the time, there is no home-field advantage, and if you are down by four with no one on and two outs in the bottom of the ninth, you have a 0.25 percent chance of winning.
“So that means 1 in 400 teams won in this situation,” Eisen says. “Of course, most of them were playing the Red Sox.”
The students are clearly more interested in the game than in possible applications to genetics. “I was actually scared of the biology part,” says freshman Jesse Rothstein. So far no one from the class has made the jump to bioinformatics. But that doesn’t mean they won’t be using the class material in their careers.
“You should all know, there’s an internship available with the A’s in statistical analysis,” Fraser tells the class, going on to read the description.
“Damn,” Eisen says. “If I weren’t teaching….”